Hyde (History database of the Global Environment)
Much of the work at PBL is focused on exploring current and possible future developments and policy options. However, one needs to have a good understanding of the past in doing so. Therefore, effort has been put into creating historical trends of various indicators, the HYDE database. HYDE has been specifically designed to support the integrated assessment model of IMAGE. HYDE was developed at PBL and its predecessors (RIVM and MNP), but since 2022 has moved to Utrecht University.
Scientists from various disciplines worldwide nowadays poole their knowledge of past land use — and pushed back the date when human farming and other practices began altering the planet. This is important since land use (change) has been (and still is) a significant factor to (past) climate change – and a possible tool to mitigate future climate change as well.
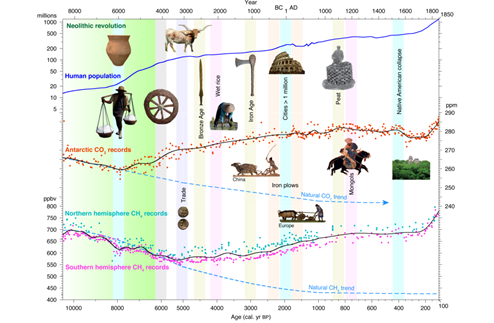
Currently, a heavily debated hypothesis about past changes in human history is the one formulated by Bill Ruddiman, a marine biologist. “His hypothesis is arguing that the significant footprint of human add-on to climate began thousands of years ago and not just 150 years or so, which is the conventional view.” Think of permanent agriculture, livestock herding, mining and largescale conversion (deforestation) of natural ecosystems. So, it really changes how we perceive the timing of human impact on the global climate system.
Therefore, HYDE covers the whole Holocene, and is not only used by IMAGE, but also by many other modelers and teachers, to better understand the underlying processes and consequences of land changes, so that we can make better policy decisions for a sustainable future.

HYDE is and internally consistent combination of updated historical population (gridded) estimates and land use for the past 12,000 years. Categories include cropland, with a new distinction into irrigated and rain fed crops (other than rice) and irrigated and rain fed rice. Also grazing lands are provided, divided into more intensively used pasture, converted rangeland and non-converted natural (less intensively used) rangeland. Population is represented by maps of total, urban, rural population and population density as well as built-up area.
Data download section
All HYDE versions can be downloaded from the Utrecht University.
References
Hyde 1.0
- Klein Goldewijk K, Battjes JJ (1995) The IMAGE Hundred Year (1890-1990) Database for Integrated Environmental Assessments (HYDE Version 1.0). National Institute of Public Health and the Environment (RIVM), Bilthoven, p. 170.
- Klein Goldewijk, C.G.M. and J.J. Battjes, 1997. A hundred year (1890 - 1990) database for integrated environmental assessments (HYDE, version 1.1). RIVM Report no. 422514002. 110 pp.
Hyde 2.0
- Klein Goldewijk K (2001) Estimating global land use change over the past 300 years: The HYDE database. Global Biogeochemical Cycles 15:417-433.
Hyde 3.0
- Klein Goldewijk K, van Drecht G (2006) HYDE 3: Current and historical population and land cover. In: Bouwman, A.F., Kram, T., Klein Goldewijk, K (eds). Integrated modelling of global environmental change. An overview of IMAGE 2.4. Netherlands Environmental Assessment Agency, Bilthoven, The Netherlands.
Hyde 3.1
- Klein Goldewijk K, Beusen A, Janssen P (2010) Long term dynamic modeling of global population and built-up area in a spatially explicit way: HYDE 3.1. The Holocene 20:565-573.
- Klein Goldewijk K, Beusen A, van Drecht G, de Vos M (2011) The HYDE 3.1 spatially explicit database of human induced land use change over the past 12,000 years. Global Ecology and Biogeography 20:73-86.
Hyde 3.2
- Klein Goldewijk, K., A. Beusen, J.Doelman and E. Stehfest (2017), Anthropogenic land use estimates for the Holocene; HYDE 3.2, Earth System Science Data, 9, 927-953.