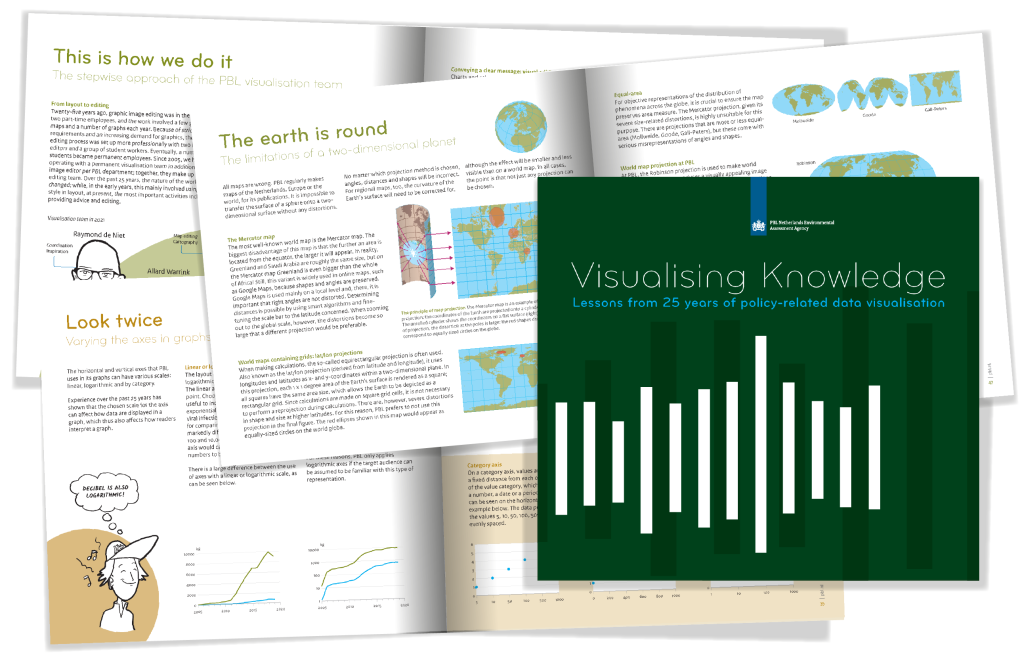
Visualising knowledge
Visualising Knowledge is the English translation of the Dutch publication: ‘Kennis verbeeld’. It marks 25 years of experience in data visualisation at PBL Netherlands Environmental Assessment Agency and its predecessors, the Netherlands Environmental Assessment Agency (MNP), Netherlands Institute for Spatial Research (RPB) and the environmental section of the National Institute for Public Health and the Environment (RIVM). The book gives an overview of how the data visualisation profession has developed over the years, the work methods of the experts in the visualisation team and the lessons learned.

PBL data visualisation is about visualising research results, using graphs, maps, diagrams and infographics. Over the years, the variety in types of visualisation formats has greatly increased. In addition, visualisations have to be presented in an increasing number of different media: from figures in reports to interactive visualisations that are easy to read on smartphones and tablets.
The book 'Visualising knowledge' provides insight into how visualisations at PBL are created in a process of close collaboration between visualisation experts, researchers and communication experts, always keeping in mind both the medium and the target audience.
Lessons learned
The visualisation experts use numerous examples to show the lessons learned, including those on the use of axes in graphs, depiction of complex concepts, representation of uncertainties, the meaning of colours and accessibility for people who are colour-blind.
Future developments
PBL's visualisation work will continue to develop in the future. Particular attention will be paid to keeping up with the rapid developments in social media and the use of animation in combination with sound and text. PBL is investing in more knowledge on the impact of visualisations, framing by means of visualisations, and how visualisations are regarded and interpreted by target audiences. The power of visualisations will also be used to develop concepts in the early stages of research, to make complex data accessible and to better understand the functioning of scientific models.
Authors
Specifications
- Publication title
- Visualising knowledge
- Publication subtitle
- Lessons from 25 years of data visualisation for policymakers
- Publication date
- 24 June 2022
- Publication type
- Report
- Page count
- 76
- Publication language
- English
- Product number
- 4855