Long-term trend in global CO2 emissions; 2011 report
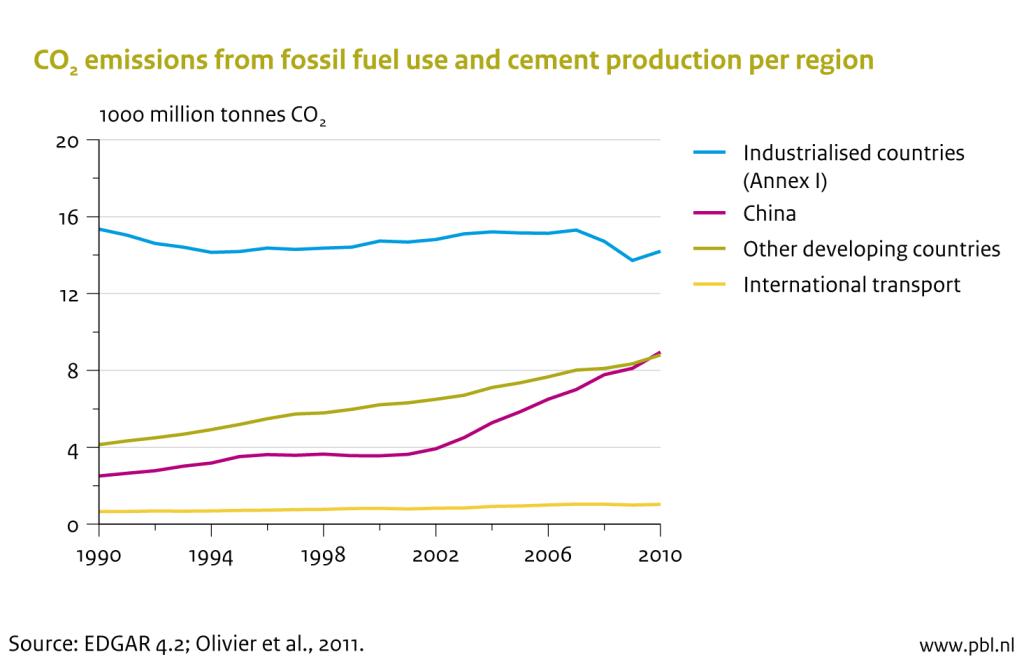
After a 1 % decline in 2009, global carbon dioxide (CO2) emissions increased by more than 5 % in 2010, which is unprecedented in the last two decades. The industrialised countries that ratified the Kyoto Protocol, together with the non-ratifying USA emitted approximately 7.5% less CO2 in 2010 than in 1990 and collectively remain on target to meet the original Kyoto Protocol objective of a 5.2% reduction. However their efforts are increasingly hidden in the global picture as their share of CO2 emissions has dropped from two-thirds to less than half.
Global CO2 emissions growth continues the long-term trend
After a 1 % decline in 2009, global carbon dioxide (CO2) emissions increased by more than 5 % in 2010, which is unprecedented in the last two decades, but similar to 1976, when the global economy was recovering from the first oil crisis and subsequent stock market crash. Continuing growth in the developing nations and economic recovery in the industrialised countries drove the record-breaking 5.8 % increase in global CO2 emissions to the all-time high of 33.0 billion tonnes, even though these have not returned to pre-recession levels in most industrialised countries. CO2 emissions went up in most of the major economies, led by China, USA, India and EU-27 with increases of 10 %, 4 %, 9 % and 3 % respectively.
The annualised average growth rate in global CO2 emissions over the last three years of the credit crunch, including a 1 % increase in 2008 when the first impacts became visible, is 1.7 %, almost equal to the long-term annual average of 1.9 % for the preceding two decades back to 1990. Global non-biogenic CO2 emissions are estimated at 22.7 billion tonnes CO2 in 1990 and 31.6 billion tonnes in 2008, while the first estimate for 2010 is 33.0 billion tonnes, an increase of 45 % since 1990, which is the same %age as in the twenty years before 1990. These figures exclude emissions from biomass burning such as forest fires, which are rather uncertain.
These preliminary estimates have been made by the PBL Netherlands Environmental Assessment Agency and the European Commission’s Joint Research Centre (JRC) on the basis of energy consumption data for 2008 to 2010 recently published by BP. The estimates are also based on production data for cement, lime, ammonia and steel and emissions per country from 1970 to 2008 from version 4.2 of the Emissions Database for Global Atmospheric Research (EDGAR), a joint project of JRC and PBL.

Industrialised countries remain on Kyoto target
Collectively the group of industrialised countries committed to a Kyoto target, i.e. excluding the USA that has not ratified the protocol, has the target of reducing their greenhouse gas emissions by 4.2 % on average for the period 2008-2012 relative to the base year, which in most cases is 1990. With an estimated average emission reduction of 16 % for 2008-2012, they are certain to exceed their target quite comfortably.
Even including the USA whose emissions in 2008-2010 are 11 % more than in 1990, the industrialised countries have on average reduced greenhouse gas emissions by about 7.5 % in the period 2008-2010, compared with 1990. Together they are well on course to achieve the protocol, target of a collective average decrease in greenhouse gas emissions of 5.2 % between 2008 and 2012 compared to the 1990 level. This is mainly due to the decreases in emissions in the countries whose economies were in transition in the early nineties and to the recent recession. The headline figure hides large national variations and several countries will not meet their national target without emissions trading, or credits purchased from certified emission reduction projects in developing countries under the UN’s Clean Development Mechanism (CDM). Overall, the impact of the Kyoto target reductions is increasingly hidden in the global picture where their share of CO2 emissions has dropped from two-thirds to less than half since 1990.
Although the global mitigation contribution of the Kyoto Protocol is limited, it can be considered as a small but important first step and it has stimulated the development of new environmental and energy diversification policies that in turn have led to many green technology developments and furthered their penetration into the energy market.

Regional differences: China and India jump while OECD countries increase
OECD countries and Russia
In Europe, CO2 emissions from industries regulated by the EU Emissions Trading Scheme (ETS) increased in 2010 by 3 %, which is substantially lower than the rebound in output, after an exceptional decline of CO2 emissions of 11.8 % in 2009. In the USA, industry emissions from fuel combustion increased by 3.8 %. Total CO2 emissions in the EU-27 increased by 3 % to 4.0 billion tonnes (in the EU-15 by 3 % to 3.1 billion tonnes) and in the USA by 4 % to 5.2 billion tonnes, after decreases in 2009 of 4 % in the EU-27 and 8 % in the EU-15 and in the USA. The CO2 emissions increased in Japan by 6.5 % to 1.2 billion tonnes and in Russia by 4 % to 1.7 billion tonnes, after decreases in 2009 of 13 % in Japan and 7 % in Russia. Total CO2 emissions of all industrialised countries that have quantitative greenhouse gas mitigation targets under the Kyoto Protocol increased in 2010 by 3.5 % (including the USA that did not ratify the protocol).
China and India
Since 2003, CO2 emissions in China have doubled, and in India they have increased by 60 %. In 2010, Chinese CO2 emissions jumped by 10 % to 9.0 billion tonnes, even though China has doubled its installed wind and solar power capacity for the sixth successive year. India, where three-quarters of the gross domestic product, goes to meet domestic demand, has also been relatively unaffected by the credit crunch and its emissions continued to increase in 2010 by 9 % to 1.8 billion tonnes of CO2. India is now the fourth largest CO2 emitter, well ahead of Russia that in fifth place and behind the EU-27.
Other developing countries
In 2010 the economies of most other developing countries also recovered from the recession in 2009, with CO2 emissions following suit. Brazil jumped 12 % (from -5 % in 2009), South Korea jumped 9 % (from 1 % in 2009). In total, CO2 emissions in these countries increased on average almost 5 % in 2010, up from 2 % in 2009.
Global emissions
In 2010, total global CO2 emissions reached 33.0 billion tonnes, a 30 % increase from 2000 and 45 % more than 1990, the base year of the Kyoto Protocol. In turn 1990 global emissions were 22.7 billion tonnes, an increase of 45 % on the 1970 level of 15.5 billion tonnes. The twenty years from 1970 to 1990 and the twenty years from 1990-2010 thus saw the same 45 % growth in global emissions.. The continuing large variation in national emission growth trends in 2010 resulted in 54 % of global emissions by developing countries and 43 % from the mature industrialised countries. The top six emitting countries, including the EU-27 block, are responsible for 70 % of total global emissions and the top 25 emitting countries more than 80 % of total emissions.
Emissions per capita
Since 1990, CO2 emissions per capita have increased in China from 2.2 to 6.8 tonne per capita and decreased in the EU-27 from 9.2 to 8.1 tonne per capita (in EU-15 from 9.1 to 7.9) and from 19.7 to 16.9 tonne per capita in the USA. Due to its rapid economic development, per capita emissions in China are quickly approaching levels common in the industrialised countries of the Annex I group under the Kyoto Protocol. Present CO2 emissions per person in China are now equal to those of Italy and higher than France, although the sectoral shares of households, transport, power generation, manufacturing industry and the service sector are quite different. Although per capita emissions of India have doubled since 1990, with 1.5 tonne per capita they remain much lower than in industrialised countries. When comparing CO2 trends between countries also trends in population numbers should also be taken into account, since population growth rates differ considerably, also between Annex I countries.
Trends in renewable energy sources
The annual growth in total renewable energy supply accelerated after 2003 from a few per cent to an average of 6 %, and 2010 had the highest growth rate since 1990 of over 7 %. Renewable energy’s share of the global energy supply has increased from 7 % by 2004 to over 8 % by 2009 and 2010 (excluding traditional biofuels such as fuelwood and charcoal). The share of nuclear power, the other non-fossil energy source, remained constant at about 6 %, for many years, with nuclear capacity increasing in line with increasing global energy consumption. Taken together nuclear and renewable energy sources have led to a decline in overall share of fossil fuels from 88 % in 1990 to about 86 %, the lowest in decades. However, in absolute terms both energy demand and the share being met by fossil fuel are growing faster since 1990 than the growth in new renewable energy sources, which is accelerating, but not yet fast enough to curb the increasing global CO2 trend.
JRC Technical Note number JRC65918
Authors
Specifications
- Publication title
- Long-term trend in global CO2 emissions; 2011 report
- Publication date
- 21 September 2011
- Publication type
- Publication
- Publication language
- English
- Product number
- 92618


